THE EX-POST MARKET
Etpa's platform stands out as the Netherlands' leading marketplace for Ex-Post trading, recognized for its liquidity and persistent growth. With a remarkable 111% Compound Annual Growth Rate (CAGR) in volume growth from 2020 to 2023, Etpa enhances trading opportunities and bolsters overall market efficiency. Market participants have collectively saved over 60 million euros through Ex-Post trading on Etpa's platform, underscoring its significance in the Dutch power market landscape. Through this white paper, we delve into the tangible benefits of Ex-Post trading, exploring its role in optimizing market dynamics and participant outcomes.
The Ex-Post market
Ex-Post trading is a pivotal post-delivery market mechanism that enables market participants to adjust nominated positions after delivery, aligning contracted energy volumes with actual consumption or production. Market participants have the chance to trade out their imbalances before being invoiced by TenneT, the Dutch TSO. They have until 9:30 a.m. on the day following delivery, to make necessary corrections to their positions. Operating within the broader power trading framework alongside the Day-Ahead and Intraday markets, Ex-Post trading minimizes risks and costs associated with imbalances.
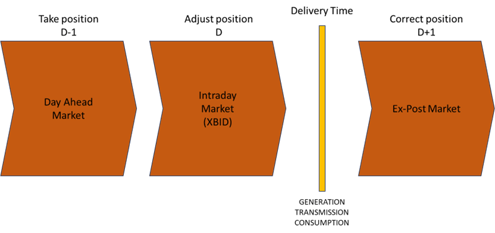
Understanding Ex-Post trading
Imbalances in power grids pose significant challenges to grid operators and market participants, occurring when there's a mismatch between forecasted and actual electricity consumption or production. In response, Transmission System Operators (TSOs) like TenneT must conduct regulation activities to ensure grid stability. The regulation state (direction of the regulation) is determined by TenneT for every Programme Time Unit (PTU)
TenneT in any PTU (96 per day) regulates:
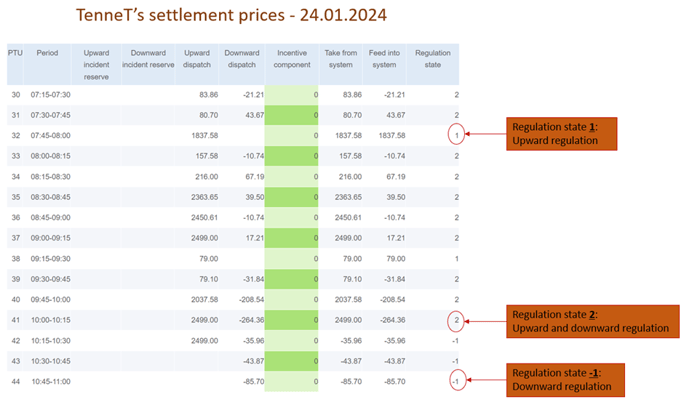
Regulation state 2
Regulation state 2 is the one creating an incentive for trading Ex-post as there is a spread between buy and sell prices (dual pricing). Below is an example (24.01.2024) of the price ladder that TenneT publishes (Table and PTU graph).

Incentive to trade Ex-Post
Ex-Post provides an efficient mechanism for risk mitigation and cost reduction related to imbalance settlement. This approach creates a mutually advantageous scenario for all parties involved, fostering a win-win situation. The selling party benefits from receiving a higher price, while the buying party pays a lower price compared to what would be invoiced by TenneT. The first table shows the outcome of the imbalance market (using values of PTU 41), while the second one shows the outcome after two market participants have traded out some of their imbalances using the Ex-Post market.
|
WITHOUT Ex-Post |
MP A |
MP B |
|
Imbalance |
+20 MWh |
-50 MWh |
|
Imbalance price |
Ramping down: -264,36 EUR/MWh |
Ramping up: 2.499 EUR/MWh |
|
TenneT invoice |
20*- 264,36 = - 5.287,2 EUR (received by TenneT from MPA – because of the negative price) |
50*2.499= 124.950 (received by TenneT from MPB) |
|
Total imbalance cost |
Paid: 5.287,2 EUR |
Paid: 124.950 EUR |
|
WITH Ex-Post |
MP A |
MP B |
|
Imbalance |
+20 MWh |
-50 MWh |
|
Ex-Post trading assuming trade for mid-price (1.117,32 EUR/MWh) |
1.117,32*20 = 22.347,2 EUR (Received from BRP B) |
1.117,32*20 = 22.347,2 EUR (Paid to BRP A) |
|
Imbalance (compared to E-program + SST’s) |
0 MWh (corrected for -20 MWh ETPA SST) |
-30 MWh (corrected for + 20 MWh ETPA SST) |
|
Imbalance price |
|
Ramping up: 2.499 EUR/MWh |
|
TenneT invoice |
No invoice |
30*2.499 = 74.970 EUR (this is going to be paid by B to TenneT) |
|
Total imbalance costs |
Received: 22.347,05 EUR |
Paid: 22.347,2 + 74.970 = 97.317,2 EUR |
Ex-Post trades on 24.01.2024
The trades represented in the graph below have taken place on our platform to trade out the imbalances occurred on delivery date 24.01.2024.

Comparing 2022, 20223, and 2024
Instances of Regulation State 2 are becoming more frequent, with the associated spreads growing increasingly extreme. The Ex-post market provides participants with the opportunity to trade out their imbalances and reduce costs during these Reg State 2 occurrences. The graphs below offer insights into the comparison of 2022, 2023, and 2024. Since data for 2024 is only available up until August 11, it has been annualized to project a full-year estimate.

Overall savings in 2022
Explore 2022 with the bubble chart below to witness how diverse company types navigated the terrain. The chart reports traded volumes and achieved savings per market participant.

Conclusion
By capitalizing on price spreads in Regulation State 2, Ex-Post trading enables efficient risk management and savings. As these instances become more common, the strategic benefits of Ex-Post trading in mitigating imbalances and enhancing market stability are increasingly evident. This white paper underscores the critical role of Ex-Post trading in optimizing market dynamics, offering insights into its impact and benefits.