
Insight
·
First Come First Serve: Understanding the Ex-Post Trading Window
An early, data-driven look at the Dutch ex-post power market shows how quickly liquidity disappears after delivery, why timing varies strongly by delivery hour, and what that means for your imbalance management strategy.

Olivier de Jonge
Summary
Most ex-post volume trades shortly after delivery; liquidity drops quickly over time.
Early imbalance insight is the main edge, as it lets you access more of that liquidity.
Fixed gate closure creates unequal trading windows by delivery time, shaping liquidity profiles across the day.
Introduction
Participants often ask the same question: when do I need to know my imbalance position to trade ex‑post effectively? Trading is possible from 15 minutes after delivery until 09:30 the next morning, but most trading activity occurs early on in the trading window, with around half of volume traded in the first 3 hours and only about 40% left after 5 hours.
In this paper, we show how ex‑post liquidity decays over time, what the first five months of 2026 and previous years reveal, how trading windows differ by delivery time and what this implies for your own imbalance management.
Why ex-post liquidity decays over time
The reason remaining liquidity falls over time is structural in nature. Once the ex-post market opens, participants are no longer trading against an expanding set of opportunities for a given delivery period. They are trading a limited pool of imbalance positions. As those positions are identified and exchanged, the remaining tradable volume decreases.
In practice, how quickly a participant discovers their imbalance depends on several operational drivers: the quality of short‑term forecasting, the speed and granularity of metering and allocation data and the latency of internal data flows. Participants that invest in faster, more automated forecasting and telemetry processes will typically gain earlier insights in their imbalance positions and can therefore access a larger share of the ex‑post liquidity.
At the same time, the number of hours available for trading after delivery varies per delivery period. This effect of this difference will be investigated later.
What the first five months of 2026 show
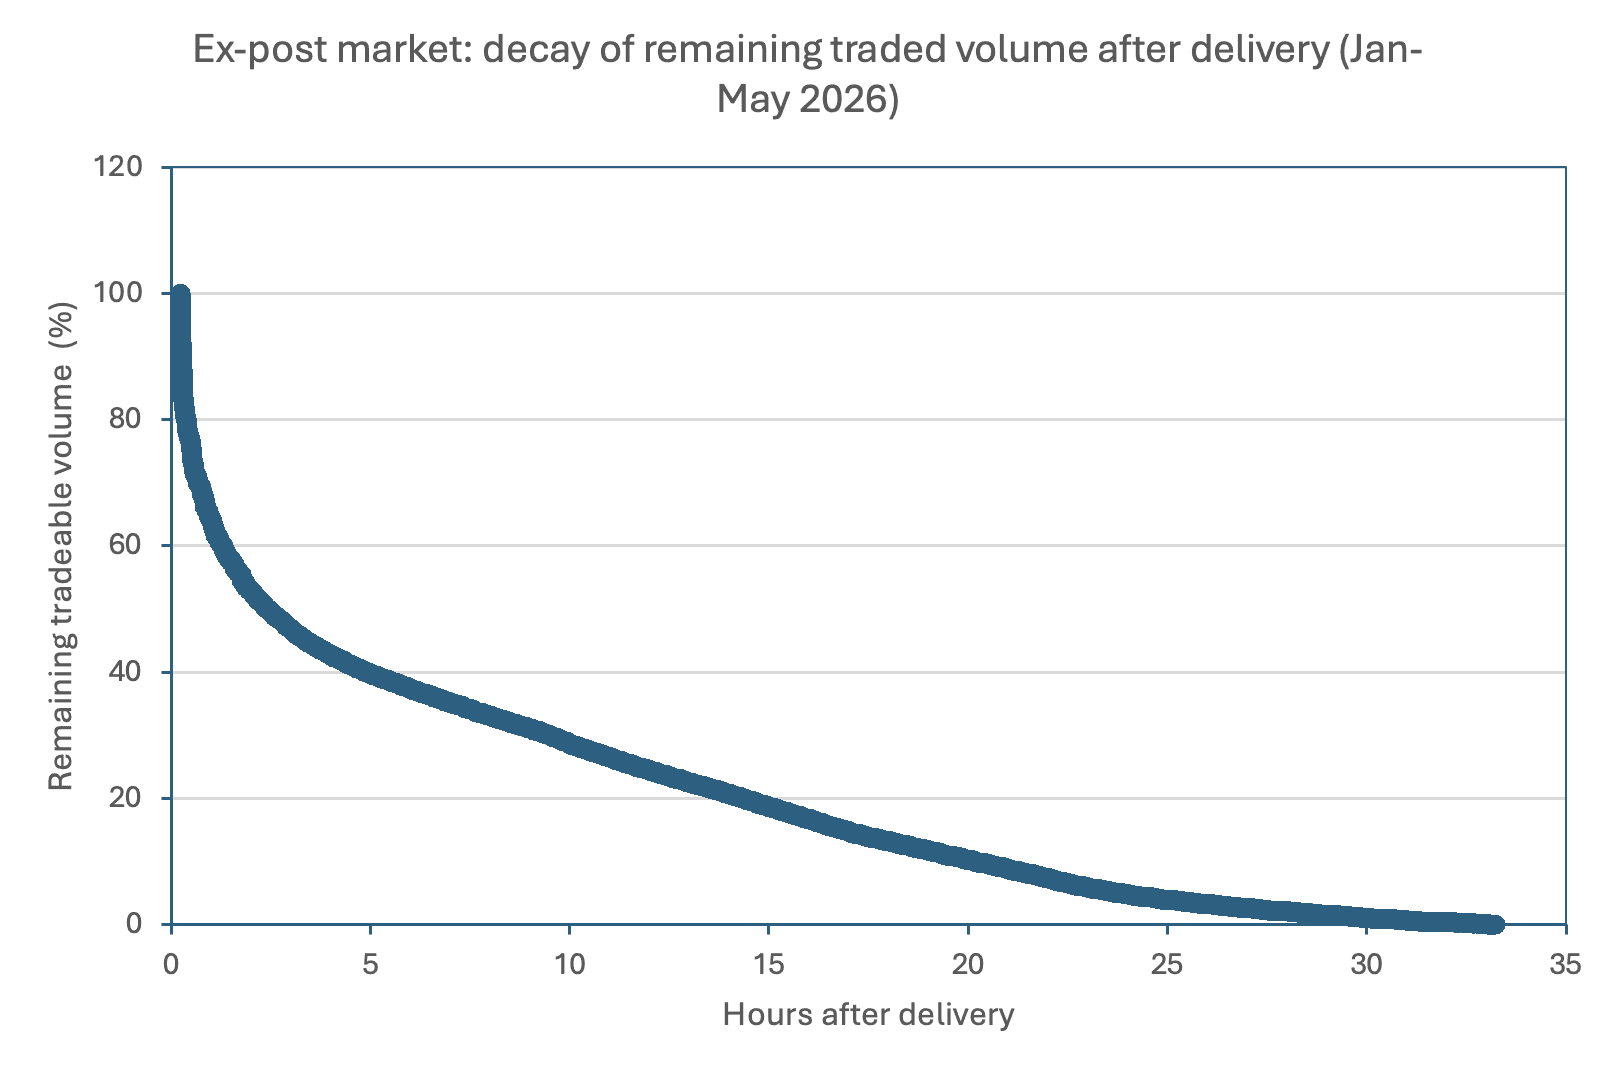
The aggregate data for the first five months of 2026 shows a strongly front-loaded ex-post market. Remaining traded volume falls sharply after delivery and then tapers off more gradually, indicating that a large share of the available volume is consumed early in the trading window. The steep initial decline reflects fast early position discovery and execution, as participants identify residual imbalances and bring them to market shortly after delivery.
Roughly 50% of ex-post trading takes place within the first 3 hours after delivery, and by 5 hours after delivery only around 40% of total volume remains to be traded. While the market stays open until 9:30 the following day, the effective liquidity window is materially shorter. Participants that can identify their imbalance position early are therefore not just acting sooner; they are acting while the residual opportunity set is still relatively deep.
At the same time, this aggregate curve should not be read as a perfect like-for-like representation across all delivery periods. The number of trading hours available after delivery varies materially by delivery time, and later sections look at example delivery periods in more detail to show how fixed market closure and time-of-day effects shape these differences.
Stable curves, faster starts
Across 2024, 2025 and 2026, the ex-post decay curves are broadly stable. In each year, remaining traded volume drops quickly after delivery and then tapers off more gradually, which suggests that the overall structure of the market has remained consistent over time.
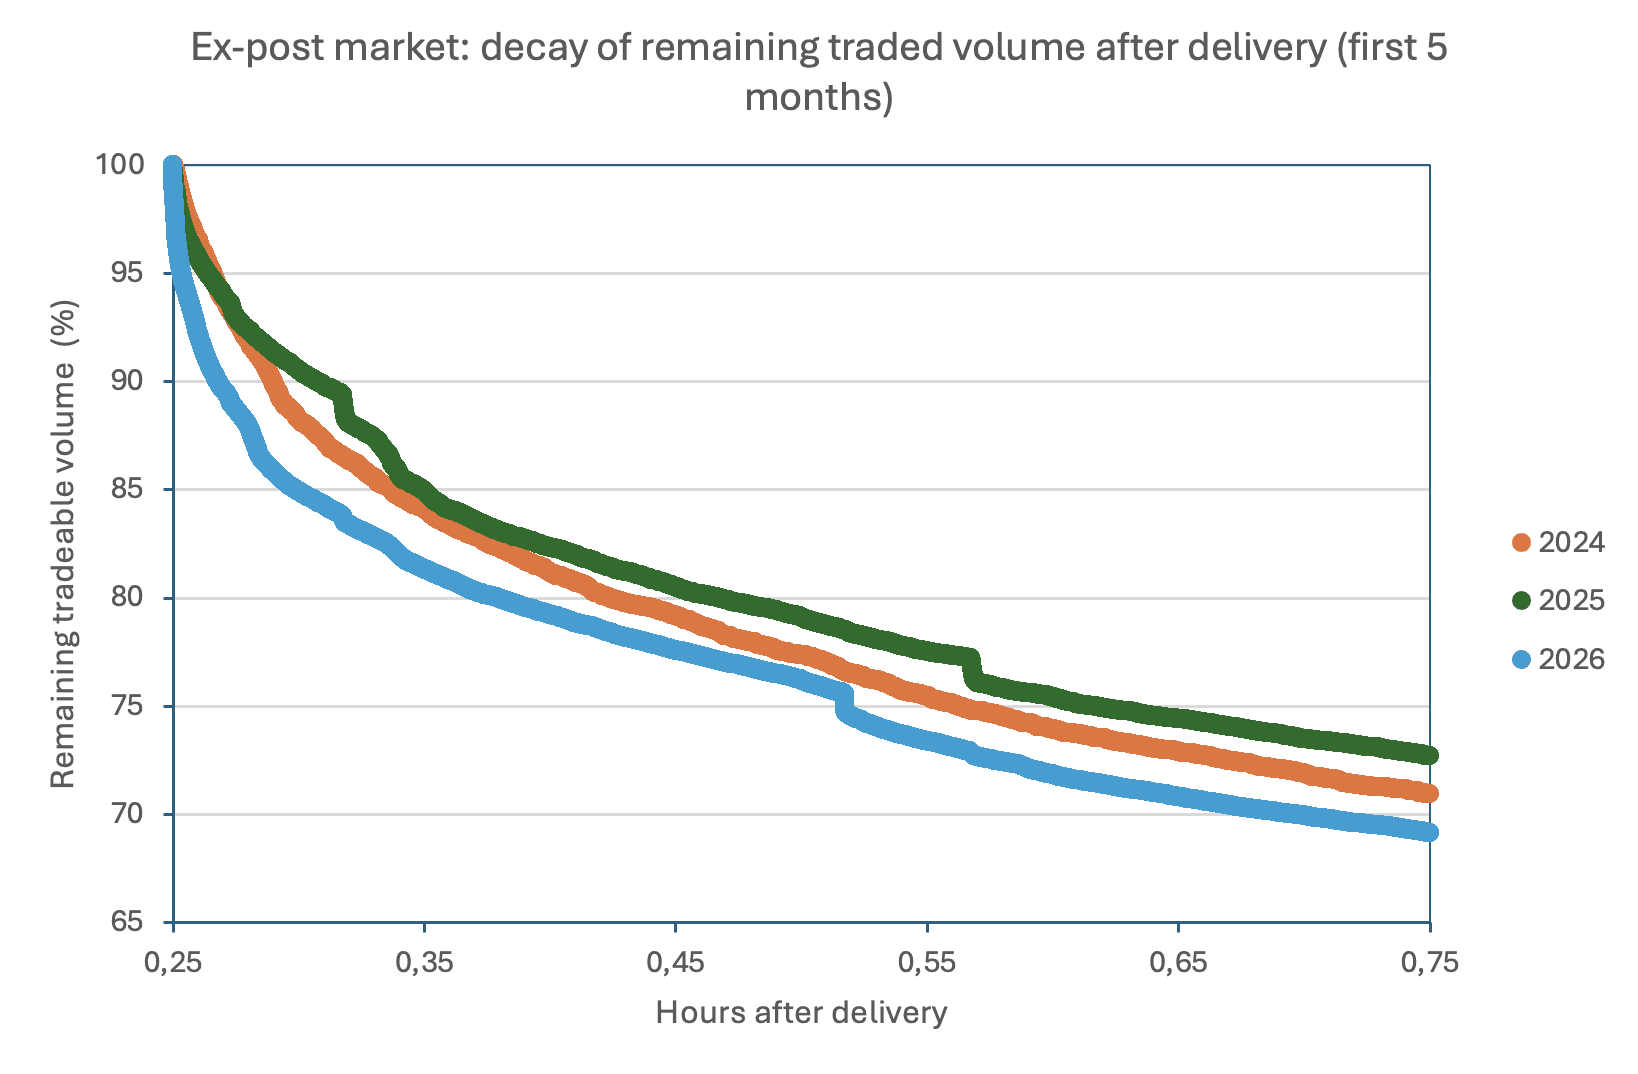
The main shift is visible in the first 30 minutes after delivery. Here, the 2026 curve falls more quickly than in 2024 and 2025, pointing to faster early position discovery and execution. After that initial window, the curves track each other very closely, suggesting that the increase in speed is concentrated at the start of the trading process rather than throughout the full post-delivery period. This likely reflects improved use of short-term forecasting, automated imbalance monitoring, a growing number of participants and increased familiarity with the ex-post product.
Not every delivery period has the same trading window
The aggregate decay curve is a useful market-wide summary, but it obscures an important structural difference: because ex-post gate closure is fixed at D+1 09:30, the available trading window varies significantly by delivery period. A night quarter-hour delivered at 01:00 still has roughly 32 hours of trading ahead, while an evening quarter-hour delivered at 22:00 has only around 11. The table below shows the results across delivery periods. In total, around 700 GWh has been traded so far this year (exchange reported double-sided volume).
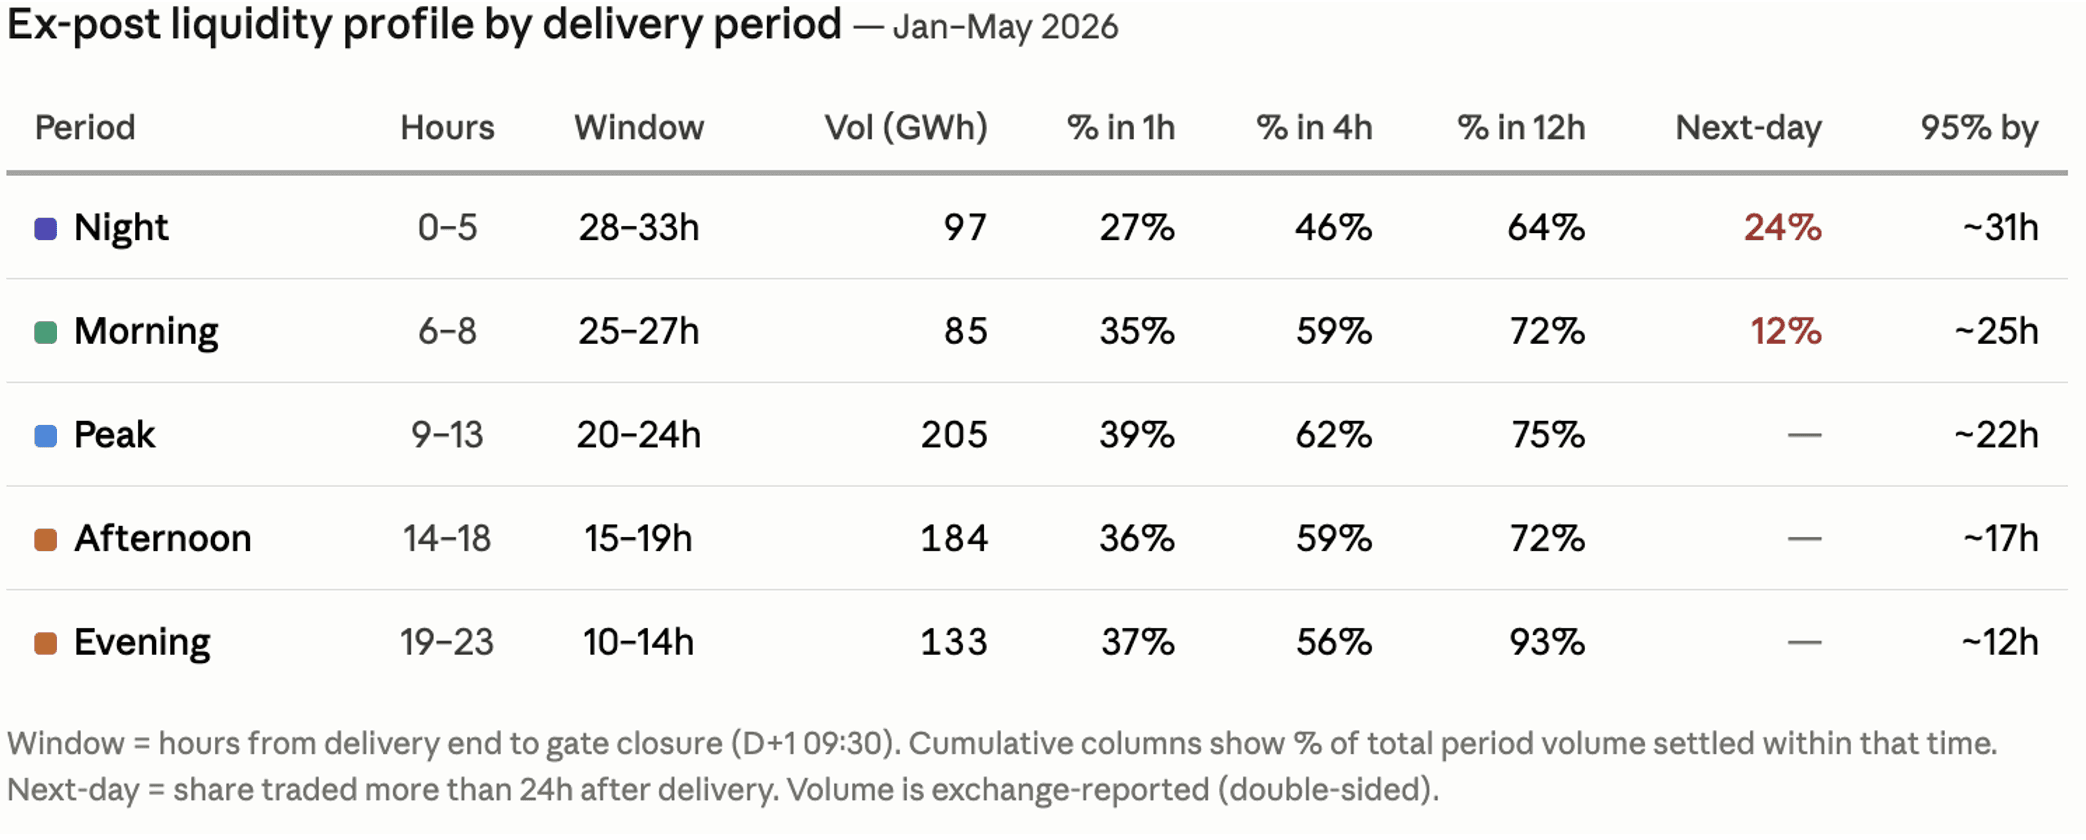
This asymmetry shapes the observed liquidity profiles in two ways. First, it creates a mechanical compression effect. Evening periods settle faster not because they are inherently more liquid, but because gate closure forces all remaining activity into a shorter window, 93% of volume clears within 12 hours simply because there is no time left for a longer tail. Night periods, by contrast, show 24% of volume settling after 24 hours, largely because they can.
Second, the trading window interacts with trader activity patterns. Peak and afternoon hours benefit from both: a reasonably long window (15–24 hours) and delivery during active trading hours, when desks are staffed and reacting quickly. This likely explains why these periods show the strongest early liquidity, 39% within the first hour for peak, despite not having the longest available window. Night hours have the most time available but the weakest early response, because the first real trading wave only arrives the next morning.
In short, the speed of observed settlement reflects three overlapping factors: how much time remains until gate closure, when during the trading day that time falls, and how quickly participants identify and act on their imbalance positions.
What one ISP reveals in practice
The example below shows all ex‑post trades for a single quarter‑hour on 11 April 2026 at 14:00. Remaining cumulative volume falls quickly in the first set of trades, dropping from over 90% to around 50% within a relatively short time after delivery. After that first wave, there is a long period with no activity for this ISP, followed by a small second cluster of trades much later in the ex‑post window, where the remaining volume is already in the low‑teens or single‑digit range.
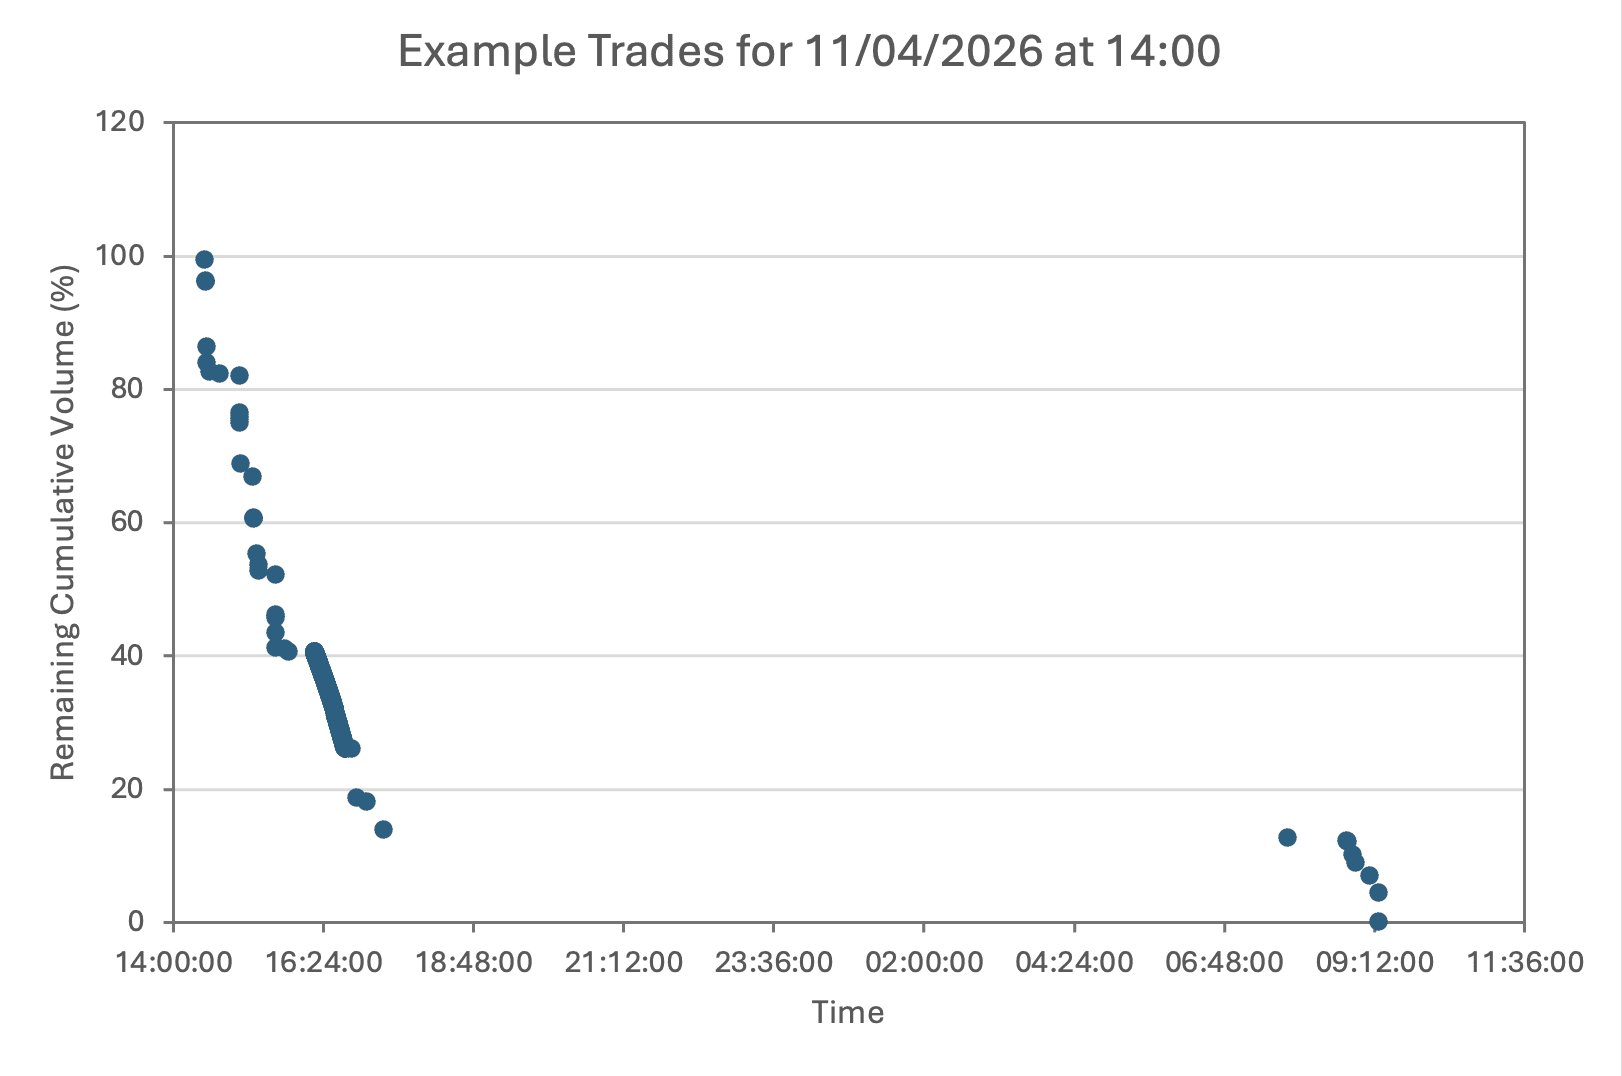
This pattern shows that, even at ISP level, trading does not spread evenly across the full trading window. Most of the volume is executed in an early burst once the imbalance is recognised and processed operationally. The later trades look more like residual clean‑up of a small remaining position, rather than a continuous, finely‑tuned optimisation over time. For participants, the message is consistent with the aggregate results: the main opportunity to trade a meaningful volume in the ex‑post market is concentrated in the early part of the window, while late trading tends to be limited to tidying up what is left.
Conclusion
For new participants, getting started in ex-post is not just about access to the market, but about access at the right moment. The faster you can identify and act on your position, the more of the available liquidity you can still reach.